Data Quality Evaluation using a Rapid AI Prototyping Part 1
I keep hearing “data quality” being the top issue for many industries, including banks, insurance companies and telcos. Especially with changes in the market and M&A activities, it is now even harder to determine and improve your data quality. Data and data science teams spend the majority of their time on data preparation and cleaning, and business users don’t really know what all that preparation and cleaning really means for them, especially for their critical data.
In these two articles, we describe a rapid method for evaluating data quality that business teams can utilize. In Part 1, we describe how to do basic data quality metrics and how to measure them utilizing the TAZI Profiler and also TAZI Rapid Model Prototyping tools. In the follow up article (Part 2) we delve into how to associate value with data quality and prioritize data monitoring and maintenance tasks.
Basic Data Quality Metrics:
The most agreed upon metrics for data quality are Accuracy, Completeness, Consistency, Timeliness, Uniqueness, Validity. We will define and utilize the TAZI Profiler (Figure 1) and TAZI Rapid Prototyped AI Predictors (Figure 2) to measure them. TheTAZI Jupyter notebook integration is also available for a more detailed analysis.

Figure 1: TAZI Profiler performs statistical analysis of all your data columns.
Accuracy: how closely data represents the real-world values it is supposed to model?
Data is accurate when it is free of errors and reflects true information.
How to Measure: The best way to measure accuracy is to check with the source. In addition to that the following are possible:
- Statistical Analysis: Use statistical measurements in the TAZI Profiler (min, max, mean, median, mode, std, skewness, curtosis, box plots and also visualizations of distributions themselves) to identify outliers, or anomalies that suggest inaccuracies.
- Rapid Prototyped AI Predictors: Using TAZI’s quick model creation feature create a number of auto configured predictors for each important data column, utilizing models trained on different subsets of data columns, or rows. Flag data as inaccurate when the predicted outcomes are inconsistent with the observed value.
Note that this works for data columns that are related to other data columns and hence can be predicted based on them.
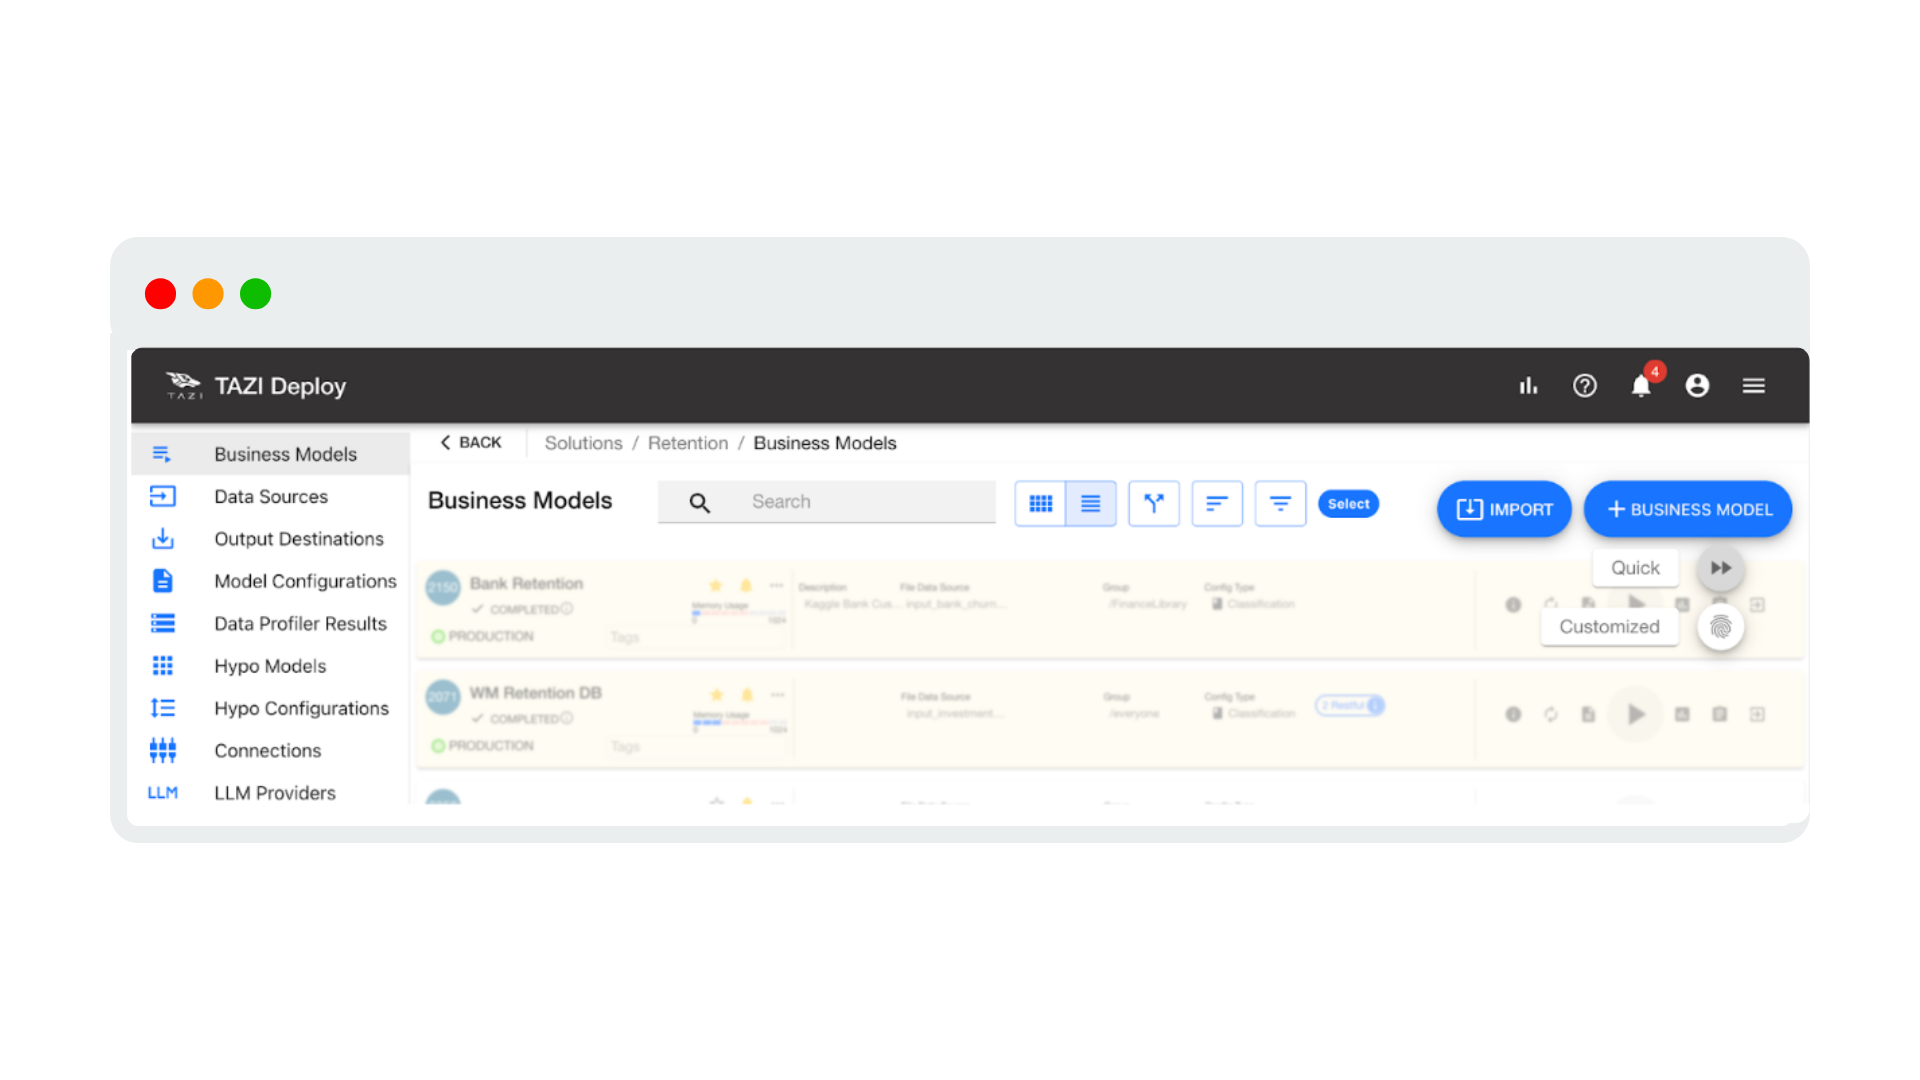
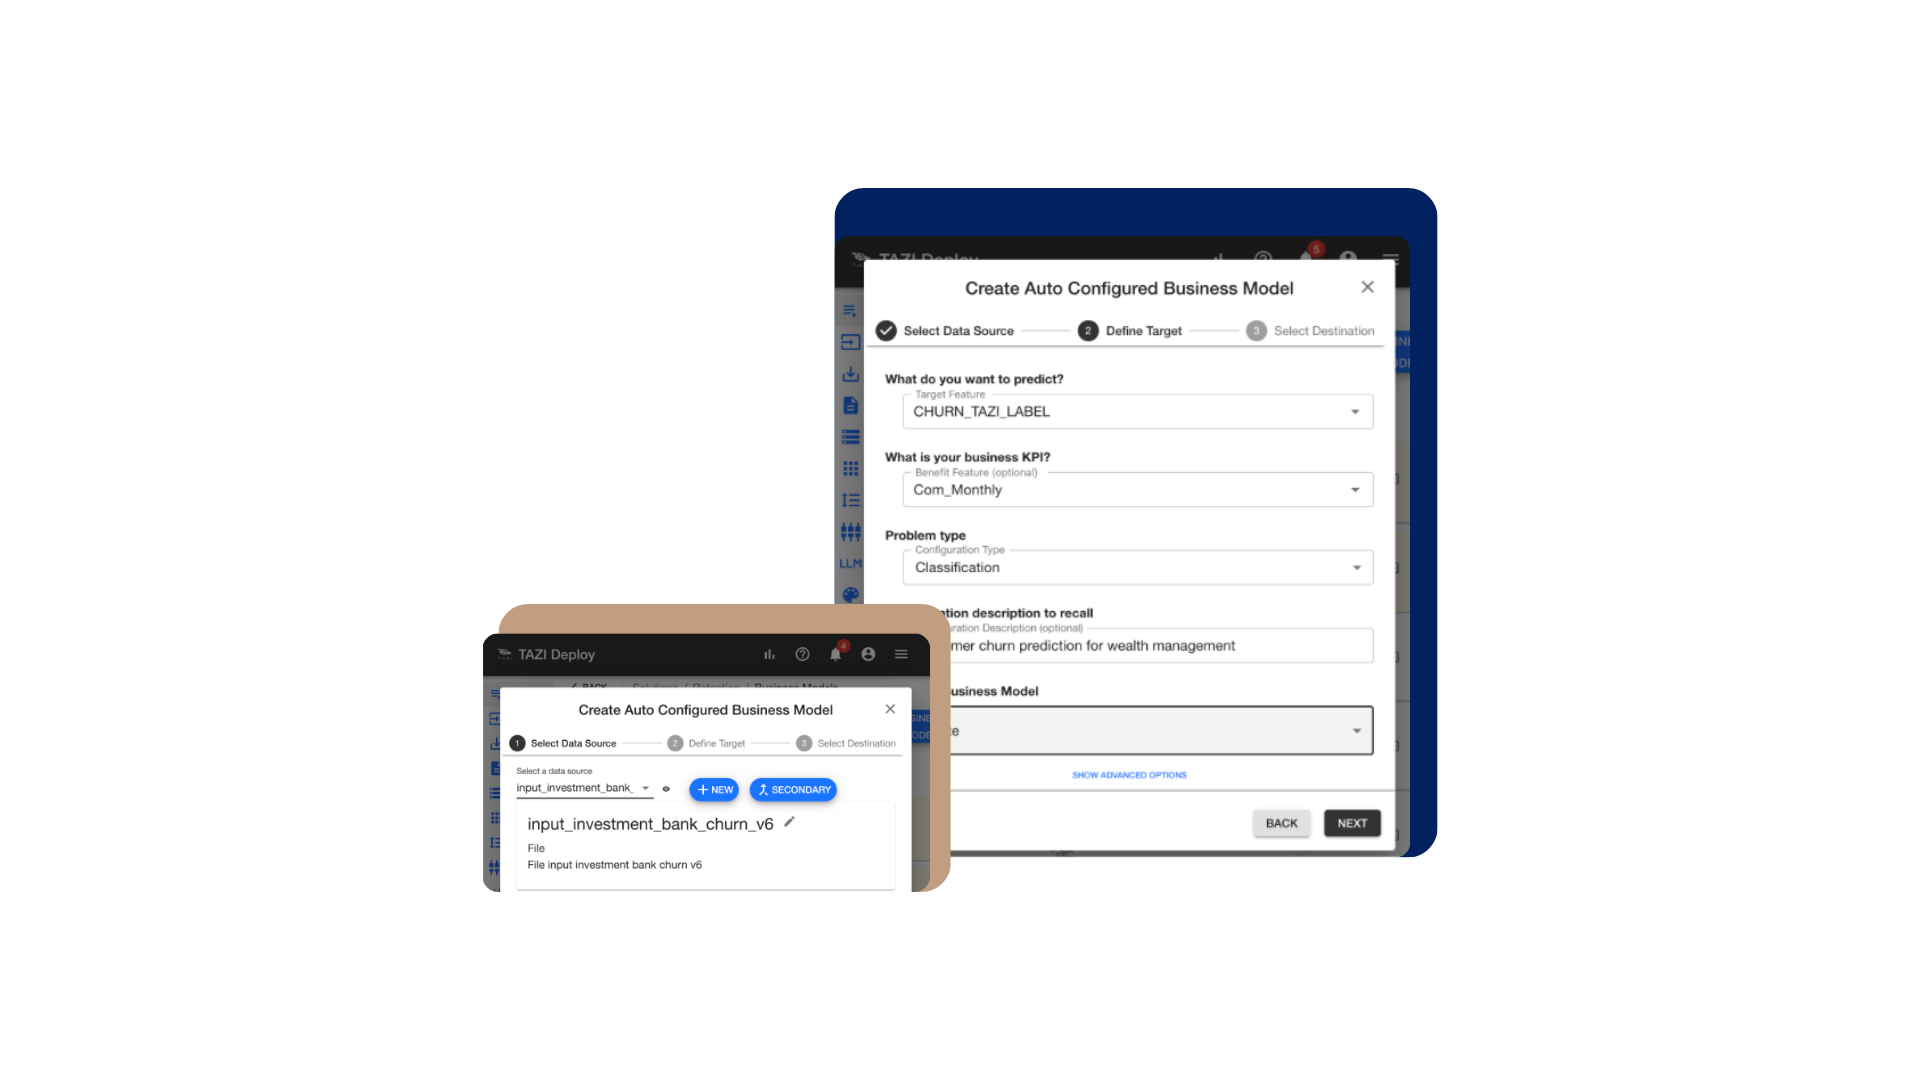
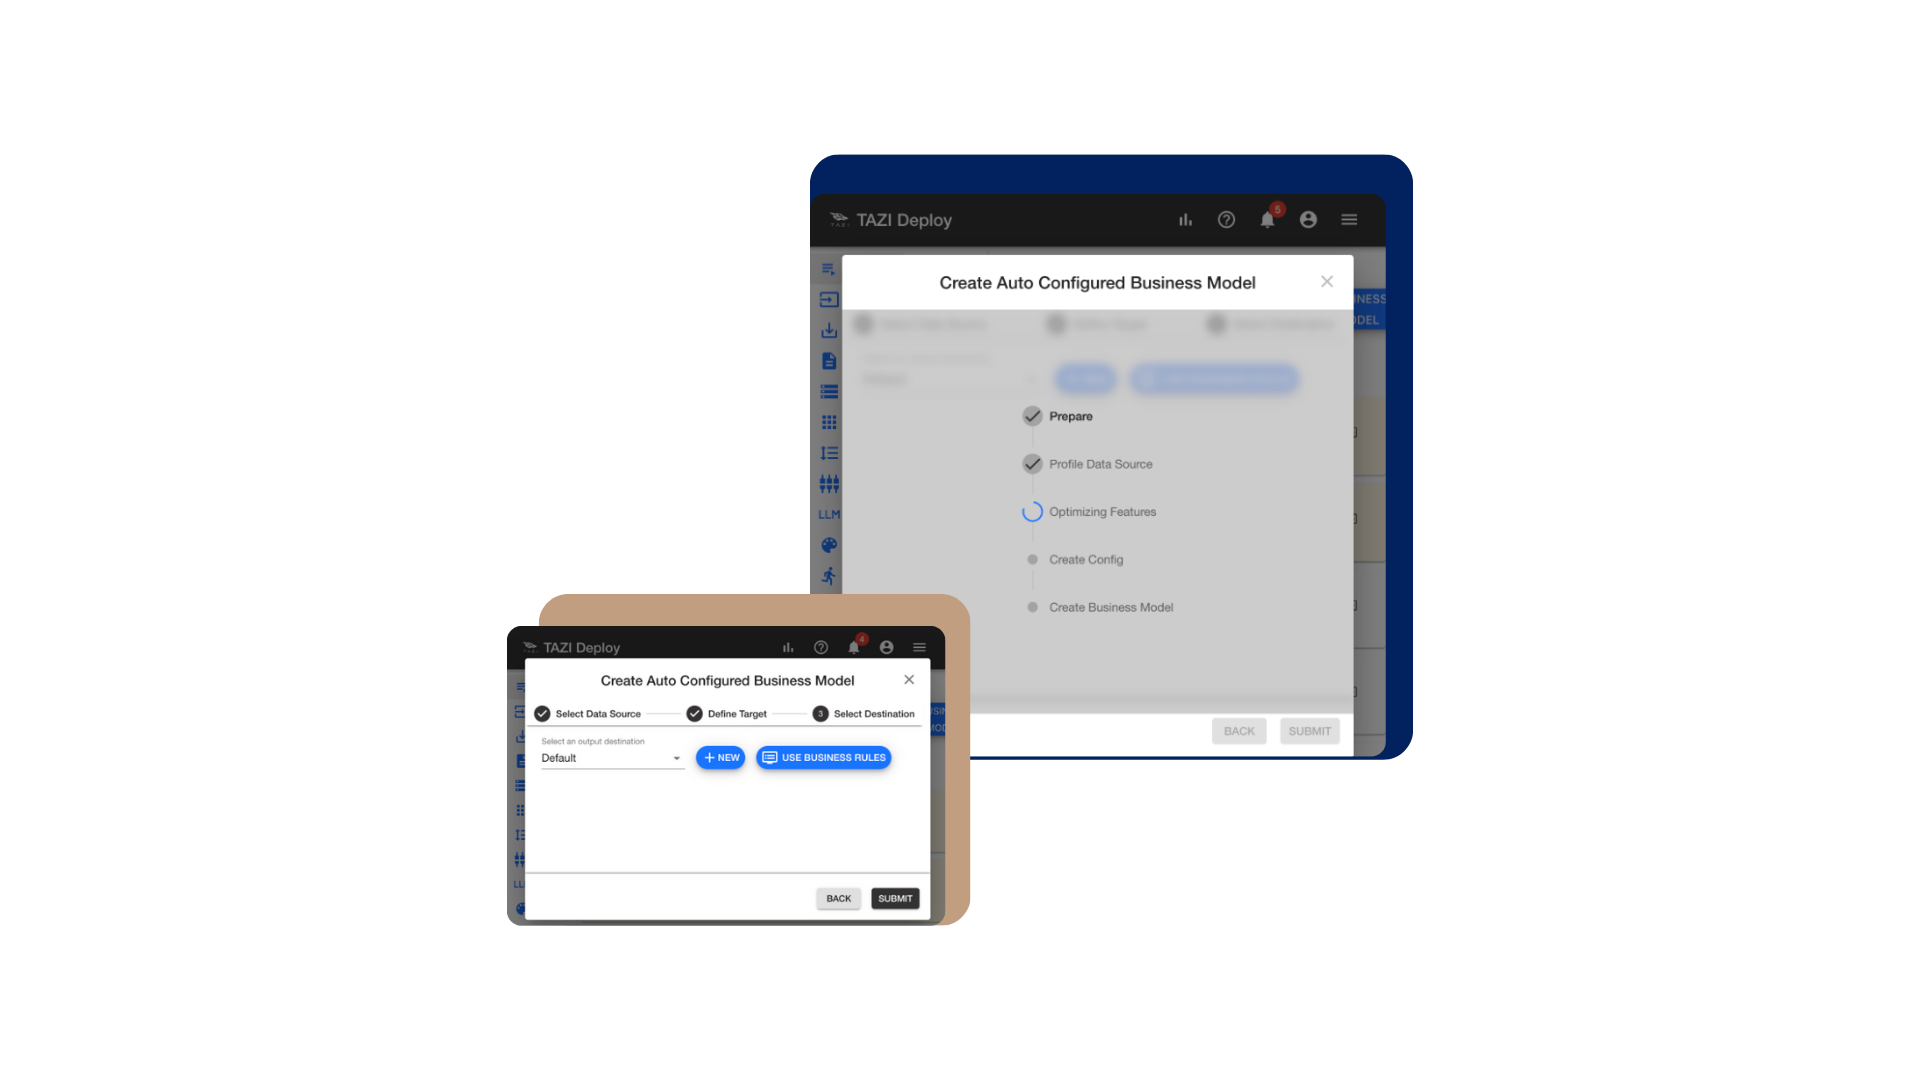
Figure 2: Using TAZI for Rapid Prototyping an AI Predictor in 5 steps.
Completeness: is all the required data present?
Data is complete if it has all the necessary fields filled for its intended purpose.
How to Measure:
Statistical Analysis: Number of empty rows (Empty Count) measured in the TAZI Profiler divided by the total number of rows.
Rapid Prototyped AI Predictors: While the traditional completeness requires column-wise completeness (e.g. are 100% of email addresses are filled in or 95%), completeness can also be interpreted based on specific business tasks, such as customer retention detection, prediction, or prescription. For this, you can utilize the TAZI’s quick model creation feature to determine the accuracies and business value created with models, you can also just utilize the relevance values from the Profiler results (Figure 1).
Note: we will delve more into this in Part 2 of this article.
Consistency: is the data same across different systems or datasets?
Data should not have conflicting values when compared to similar datasets.
How to Measure:
Statistical Analysis:
- For consistency checking within the same dataset, to check one field’s consistency use the unique identifier to aggregate the data (numerical: min, max, mean, std, first, last, non-numerical: mode, #unique values, distribution across different values) utilizing TAZI feature engineering.
- For consistency checking across different systems, combine the two datasets while creating the input to TAZI using unique identifiers. Check if feature values are the same for both datasets. Also check if there are null/empty values. And check the consistency of the automatically assigned data type across different columns.
Timeliness: how up-to-date and available is data when needed?
Data must be current and accessible to be useful.
How to Measure:
Measure the age of the data (e.g., how recent the last update was) and its latency (delay between the generation of data and its availability for use). To check for timeliness utilize the statistical analysis algorithms you used for consistency checking on the timestamps.
Uniqueness: are there duplicated records or values in a dataset, especially where unique identifiers are expected?
How to Measure: Ensure that primary keys (customer id etc.) are truly unique (TAZI Profiler statistics, “Number of Unique Values”). (Figure 1)
Validity: how well data conforms to the rules or constraints defined for it?
Data is valid if it follows the formats, types, and ranges expected.
How to Measure:
- Basic: Use the TAZI Profiler and measure malformed counts as well as ranges and distributions.
- Advanced: Use TAZI Profiler’s data drift detection (Figure 3) to understand where data has changed if the resulting data is valid or not.
Note: Keep in mind that the data you have collected for training/testing models, or other purposes, and the data you see in production could be very different. So, you want to make sure that you follow the data quality measurement steps continuously on the production data.

Figure 3: TAZI Profiler Data Drift Detection.
Start Now: Don't Wait for Perfect Data
See also these articles on Forbes Technology Council about data quality and preparation.